WHETHER ANY SECURITY MEASURES WERE INSTALLED OR UPGRADED IN LAST 12 MONTHS (Table 32)
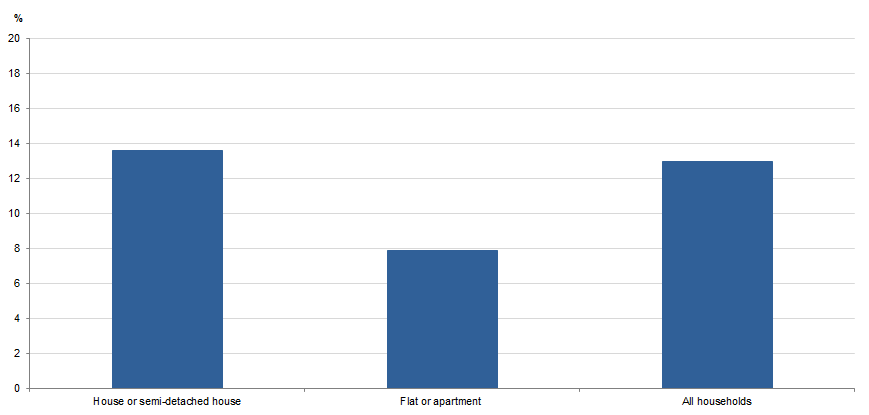
Approximately one in eight households (13% or 1.2 million) installed or upgraded at least one security measure during the 2017–18 reference period. A higher proportion of houses or semi-detached houses (14% or 1.1 million) installed or upgraded at least one security measure compared to flats or apartments (7.9% or 84,600).
HOUSEHOLDS, Selected security measures installed or upgraded in the last 12 months, by dwelling type, Australia, 2017–18

Australian Bureau of Statistics
© Commonwealth of Australia 2019.
Approximately one in twenty households (5.0% or 465,900) installed or upgraded at least one security measure during the 2017–18 reference period because of a perceived increase in crime or public nuisance in their area.Endnote1
WHETHER ANY SECURITY MEASURES WERE INSTALLED OR UPGRADED BY EXPERIENCE OF SELECTED CRIME TYPES (Tables 33 and 34)
This section explores whether a household installed or upgraded security in the last 12 months, by experiences of selected personal and household crimes in the last 12 months. These results do not necessarily imply a causal relationship, as the survey does not identify whether the security measures were installed or upgraded before or after experiencing the crime type. Caution should be used when interpreting these data.
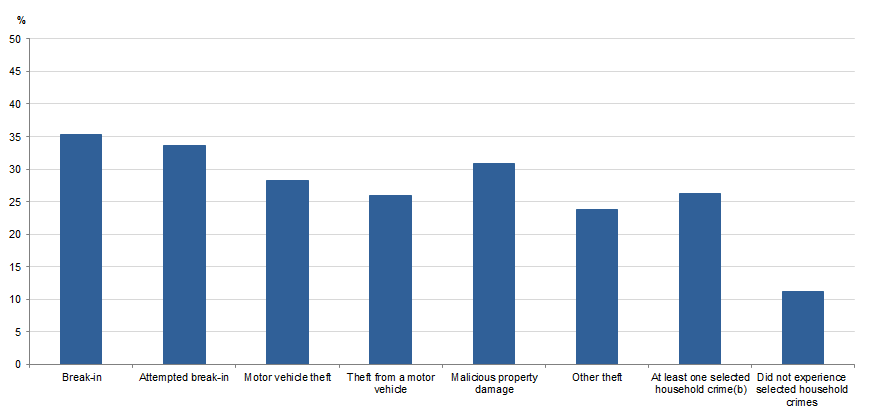
Households which experienced at least one selected household crime in the 2017–18 reference period, were more likely to have installed or upgraded at least one home security measure (26%), compared to households which did not experience a selected household crime (11%).Endnote2
HOUSEHOLDS, Whether upgraded or installed home security in the last 12 months, by experience of selected household crimes(a), 2017–18

Footnote(s): (a) The survey does not identify whether the security measures were installed or upgraded before or after experiencing the crime type, as such caution should be used when interpreting these data. (b) The total cannot be calculated from the components, where a household has experienced more than one crime type, they are counted separately for each crime type but are only counted once in the aggregated total.
Australian Bureau of Statistics
© Commonwealth of Australia 2019.
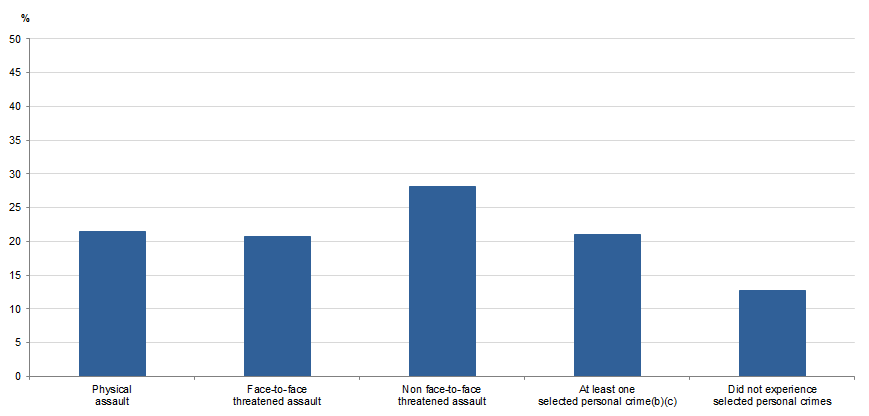
Persons who experienced a selected personal crime in the 2017–18 reference period were more likely to live in a household which installed or upgraded at least one home security measure (21%) compared to persons who did not experience any of the selected personal crimes (13%).Endnote2
PERSONS AGED 15 YEARS AND OVER, Whether lives in a household which upgraded or installed home security in the last 12 months, by experience of selected personal crimes(a), 2017–18

Footnote(s): (a) The survey does not identify whether the security measures were installed or upgraded before or after experiencing the crime type, as such caution should be used when interpreting these data. (b) Includes physical assault, face-to-face threatened assault, non face-to-face threatened assault and robbery for persons aged 15 years and over and sexual assault for persons aged 18 years and over only. (c)The total cannot be calculated from the components, where a persons has experienced more than one crime type, they are counted separately for each crime type but are only counted once in the aggregated total.
Australian Bureau of Statistics
© Commonwealth of Australia 2019.
WHETHER WANTED TO IMPROVE HOME SECURITY BUT WERE NOT ABLE TO (Table 32)
Approximately one in ten Australian households (11% or 1.1 million) wanted to improve their home security but were unable to do so.
The following households were more likely to have wanted to improve their home security but couldn’t:
- houses or semi-detached houses (12%) compared to flats or apartments (7.0%)
- households in the lowest quintile of equivalised weekly household income (14%) compared to households in the highest quintile (8.4%)
- households in the lowest quintile of the Index of Relative Socio-Economic Advantage and Disadvantage (14%) compared to households in the highest quintile (8.1%).Endnote 3
ENDNOTES
Endnote 1 Public nuisance includes behaviours that are offensive, disorderly, threatening or violent in a public place. The behaviours may cause offence or interfere with someone’s ability to move through, or peacefully enjoy a public place.
Endnote 2 The survey does not identify whether the security measures were installed or upgraded before or after experiencing the crime type, as such caution should be used when interpreting these data.
Endnote 3 The Index of Relative Socio-Economic Advantage and Disadvantage ranks areas on a continuum from most disadvantaged to most advantaged. Lower quintiles indicate greater levels of disadvantage and a lack of advantage in general compared to higher quintiles. For further information, see Explanatory Notes.
 Print Page
 Print All
 Quality Declaration